|
|
|
|
|

|
|
|
|
|
|
|
Fifty Years of Physiologic Monitors By
the Engineering staff of Femtosim
Clinical Inc. This
article was originally released in August 2005 to coincide
with the "50th anniversary" of the appearance of commercial
physiologic monitors. Since then we have updated and
expanded the content. We invite you to comment on this
subject and, please; send us an image of an "experienced"
monitor from your facility for inclusion here. Last
review: June 6, 2018 Sponsored
by KaleidoSim 2 and KaleidoSim
2 Prime: The serious kaleidoscope simulation available on
Android.
Physiologic
monitors have been in regular commercial production since
about 1954. Therefore, in recognition of those first
50 years, we have compiled a history of these interesting
devices and present some of our guesses as to where this
technology is headed. This history of physiologic
monitors looks at the technical evolution of physiologic
monitors which incorporate a cathode ray tube (CRT) or flat
panel display and that normally would be used in a hospital
setting. Please note
that the text below includes comments on monitors used
currently and in the past and does not comment on others and
this and any information herein is not meant to be construed
as an endorsement or condemnation of any devices and are
opinions of the authors. Although specific systems are
mentioned in connection with new developments, this does not
imply that the system was the first or the only system with
that feature. We have endeavored to be accurate with
the dates provided in relation to the appearance of certain
systems or features. The 1950s’: Early Warning
Systems for “Cardiac Accidents”: Himmelstein
and Scheiner reported in a 1952
paper that in January of 1950 they began using an instrument
they devised. They called it the “Cardiotachoscope”
and found it useful during surgery. It featured the
fundamental attributes that most monitoring systems would
eventually have. These attributes include a CRT to
view the ECG, a heart rate indicator, alarms for high and
low heart rates, and a connection to a conventional
electrocardiograph for printouts. This device
does not appear to have entered into
production and the “Cardiotachoscope”
term is not used anymore. Within a few years of this
original paper, commercial monitors began to appear and
eventually they and their manufacturers proliferated by the
end of the decade. Monitors of
this era were often referred to as electrocardioscopes
or cardioscopes.
Sometimes they were simply referred to as an
oscilloscope. Unlike modern monitors, devices of this
era had monochrome displays and the persistence of the wave
was generally not sufficient to cover the screen. This
meant that the ECG waveform would show only a second or two
of new data. The old data would fade away and the
trace has been described as a bouncing ball with a comets
tail. Some CRT’s were of the “long persistence” type
which meant that fading was slower
and more waveform was visible. There were no numeric
parameters or annotations on the screen. Modern
bedside monitors and modern defibrillator/pacers are
distinct types of equipment. Systems of the 1950’s and
early 1960’s made less of a distinction between the
equipment roles of monitoring and defibrillation or pacing
and were often intended to be used together as a diagnostic
and, especially, therapeutic whole at the bedside or in the
operating room on a mobile cart. Equipment used in
this sense is more closely related to what we currently find
on a hospital crash-cart: a defibrillator/monitor with
integrated non-invasive pacing. Some equipment of this
type could be set to automatically pace the patient when the
heart rate dropped to a set rate. In fact, detection
of low heart rate and initiation of an alarm or therapy was
a primary objective of this technology. The
frequency response of the ECG monitor was often less than
comparable electrocardiographs of the period.
This meant that detailed ECG assessment still required the
electrocardiograph. The advantage of the monitor was
the immediacy of the information and the ability to generate
alarms. Most devices had an output connector to allow
direct printing on a standard electrocardiograph. Most
bedside type monitors often had round screens of about 5
inches in diameter. Some had only 3-inch
diameter screens. Most bedside monitors were limited
to one or two waveform traces. The diameter of the
screen (in inches) was often incorporated as part of the
devices model number. Controls on these monitors
generally allowed for lead selection, focus adjustment,
intensity or brightness control, sensitivity or gain
control, vertical trace-position control, and sweep rate
adjustment. These type of
controls are closely related to the controls of
traditional oscilloscopes used in electronics. The use of
flammable anesthetics during this period necessitated design
considerations to prevent occurrence of a spark. This
involved encasing the device in an “explosion proof” (they
would not cause an explosion by releasing a spark) housing
or, later and more commonly, in accordance with the NFPA
“Hospital Code” of the era, by mounting the monitor at an
elevation of at least five feet above the floor and thereby
above the anesthetic gases which tended to settle to the
bottom of the operating room. A challenge
with monitors of this era was the presentation of heart rate
information. Many early units did not provide a
cardiotachometer or rate-meter to provide a heart
rate. However, the use of audible (or occasionally
visual) R-wave indicators and grid lines inscribed on the
CRT face provided the clinician with a means to calculate a
heart rate. Some monitors had an integrated
cardiotachometer in the form of an analog meter and this
became increasingly prevalent in the next decade. A
cardiotachometer was available as an add-on piece of
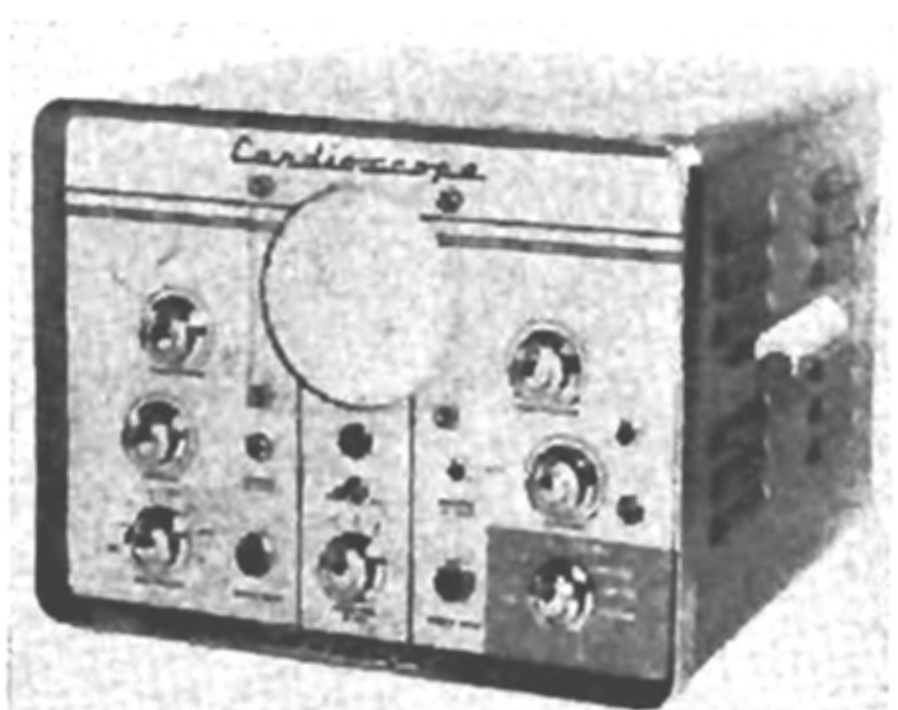
equipment or module with some systems. A prominent
early device of this decade was the Cambridge Operating Room
Cardioscope from the Cambridge
Instrument Company. This device was intended for
operating room use and appeared about 1954. The
display included a small CRT screen and analog indicators
behind the round glass portal of a torpedo-shaped explosion
proof housing. The entire device was mounted on a
stand. Electrodyne played a
prominent role in this era and this continued into the next
decade. The model PM-65 which appeared around 1956
incorporated a cardioscope
mounted on top of a large pacemaker. This device
introduced physiologic monitors into a clinical setting
(intensive care area) as opposed to being
a dedicated operating room device. Electrodyne
devices were developed, in collaboration with engineer Alan
Belgard, by the renowned Dr.
Paul M. Zoll whose name
continues to be associated with defib/monitors with
non-invasive pacemakers. Several
monitoring companies marketed new devices beginning around
the year 1957. These included Dallons,
Sanborn, and Levinthal. The monitors from Sanborn and
Levinthal were similar in physical appearance with a 5-inch
diameter CRT mounted below two knobs and above three other
knobs. The Levinthal Electronic Products Inc. device
was called a “Duo-Trace Cardioscope”
and was capable of displaying
two waveforms simultaneously. The Sanborn unit was
configured as an operating room model 169-A-OR “Viso
Scope” and mounted high on a stand. The CRT trace was
a bright yellow color. A two
waveform version was available for an additional
cost. Dallons released a
large cardioscope in 1957 and
variations thereof were marketed until the mid-1960’s at
which time it was replaced by a more compact system.
The unit included a separate “cardiophone”
device mounted on top whose audible output was related to
the rate and morphology of the ECG. The 1960s’: Proliferation
into Critical Care: The 1960’s
featured monitoring systems whose intended functions and
configurations were surprisingly similar
to more modern systems. The approach of
having central monitors and bedside monitors was common even
from the early part of the decade. Numerous parameters
were technically available to be monitored including ECG,
EEG, invasive pressures, and temperatures. However
standard parameters were restricted usually to ECG and a
more elaborate setup would be necessary for more
parameters. Modular pre-amplifiers were available from
the vendors to deal with various combinations of patients
and parameters. Monitoring of the EEG was a common
feature of monitors of this decade and was used to assess
depth of anesthesia during surgery. EEG monitors
did develop as dedicated stand-alone devices. The process
of using telemetry to monitor physiologic signals occurred
early in this decade as well. Litton Systems offered a
telemetry system which used the standard FM frequency band
in the early 1960's. Marketers were happy to point out
that their systems, such as the Vector Guardian system
(Division of United Aircraft), incorporated the same
technology for telemetry as used in Space flight. Unlike
modern central monitors which are distinct pieces of
equipment and capable of displaying waveforms from eight or
more bedsides simultaneously, in the early part of this
decade central monitors were often identical to the bedside
monitors. The “central” would be connected to all
of the bedsides by cabling in a star pattern to a
separate switching box which would allow data to be switched
over one bed at a time for viewing on the central.
This would usually only transmit the waveform and not alarm
or other information. This might only involve one
waveform. Other more sophisticated monitors used for a
central monitor or for surgery had traditional 17” diagonal
television tubes which were occasionally mounted in a
vertical “portrait” orientation and could display a waveform
from eight different beds for example. Some centrals
included a tape memory section to record the ECG. Vendors
such as Burdick, Birtcher, Dallons, Air Shields, and Electrodyne
offered a complete line of pacemakers, defibrillators, and
physiologic monitoring systems (with a central) in the early
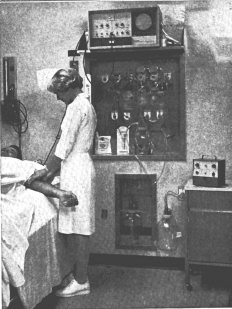
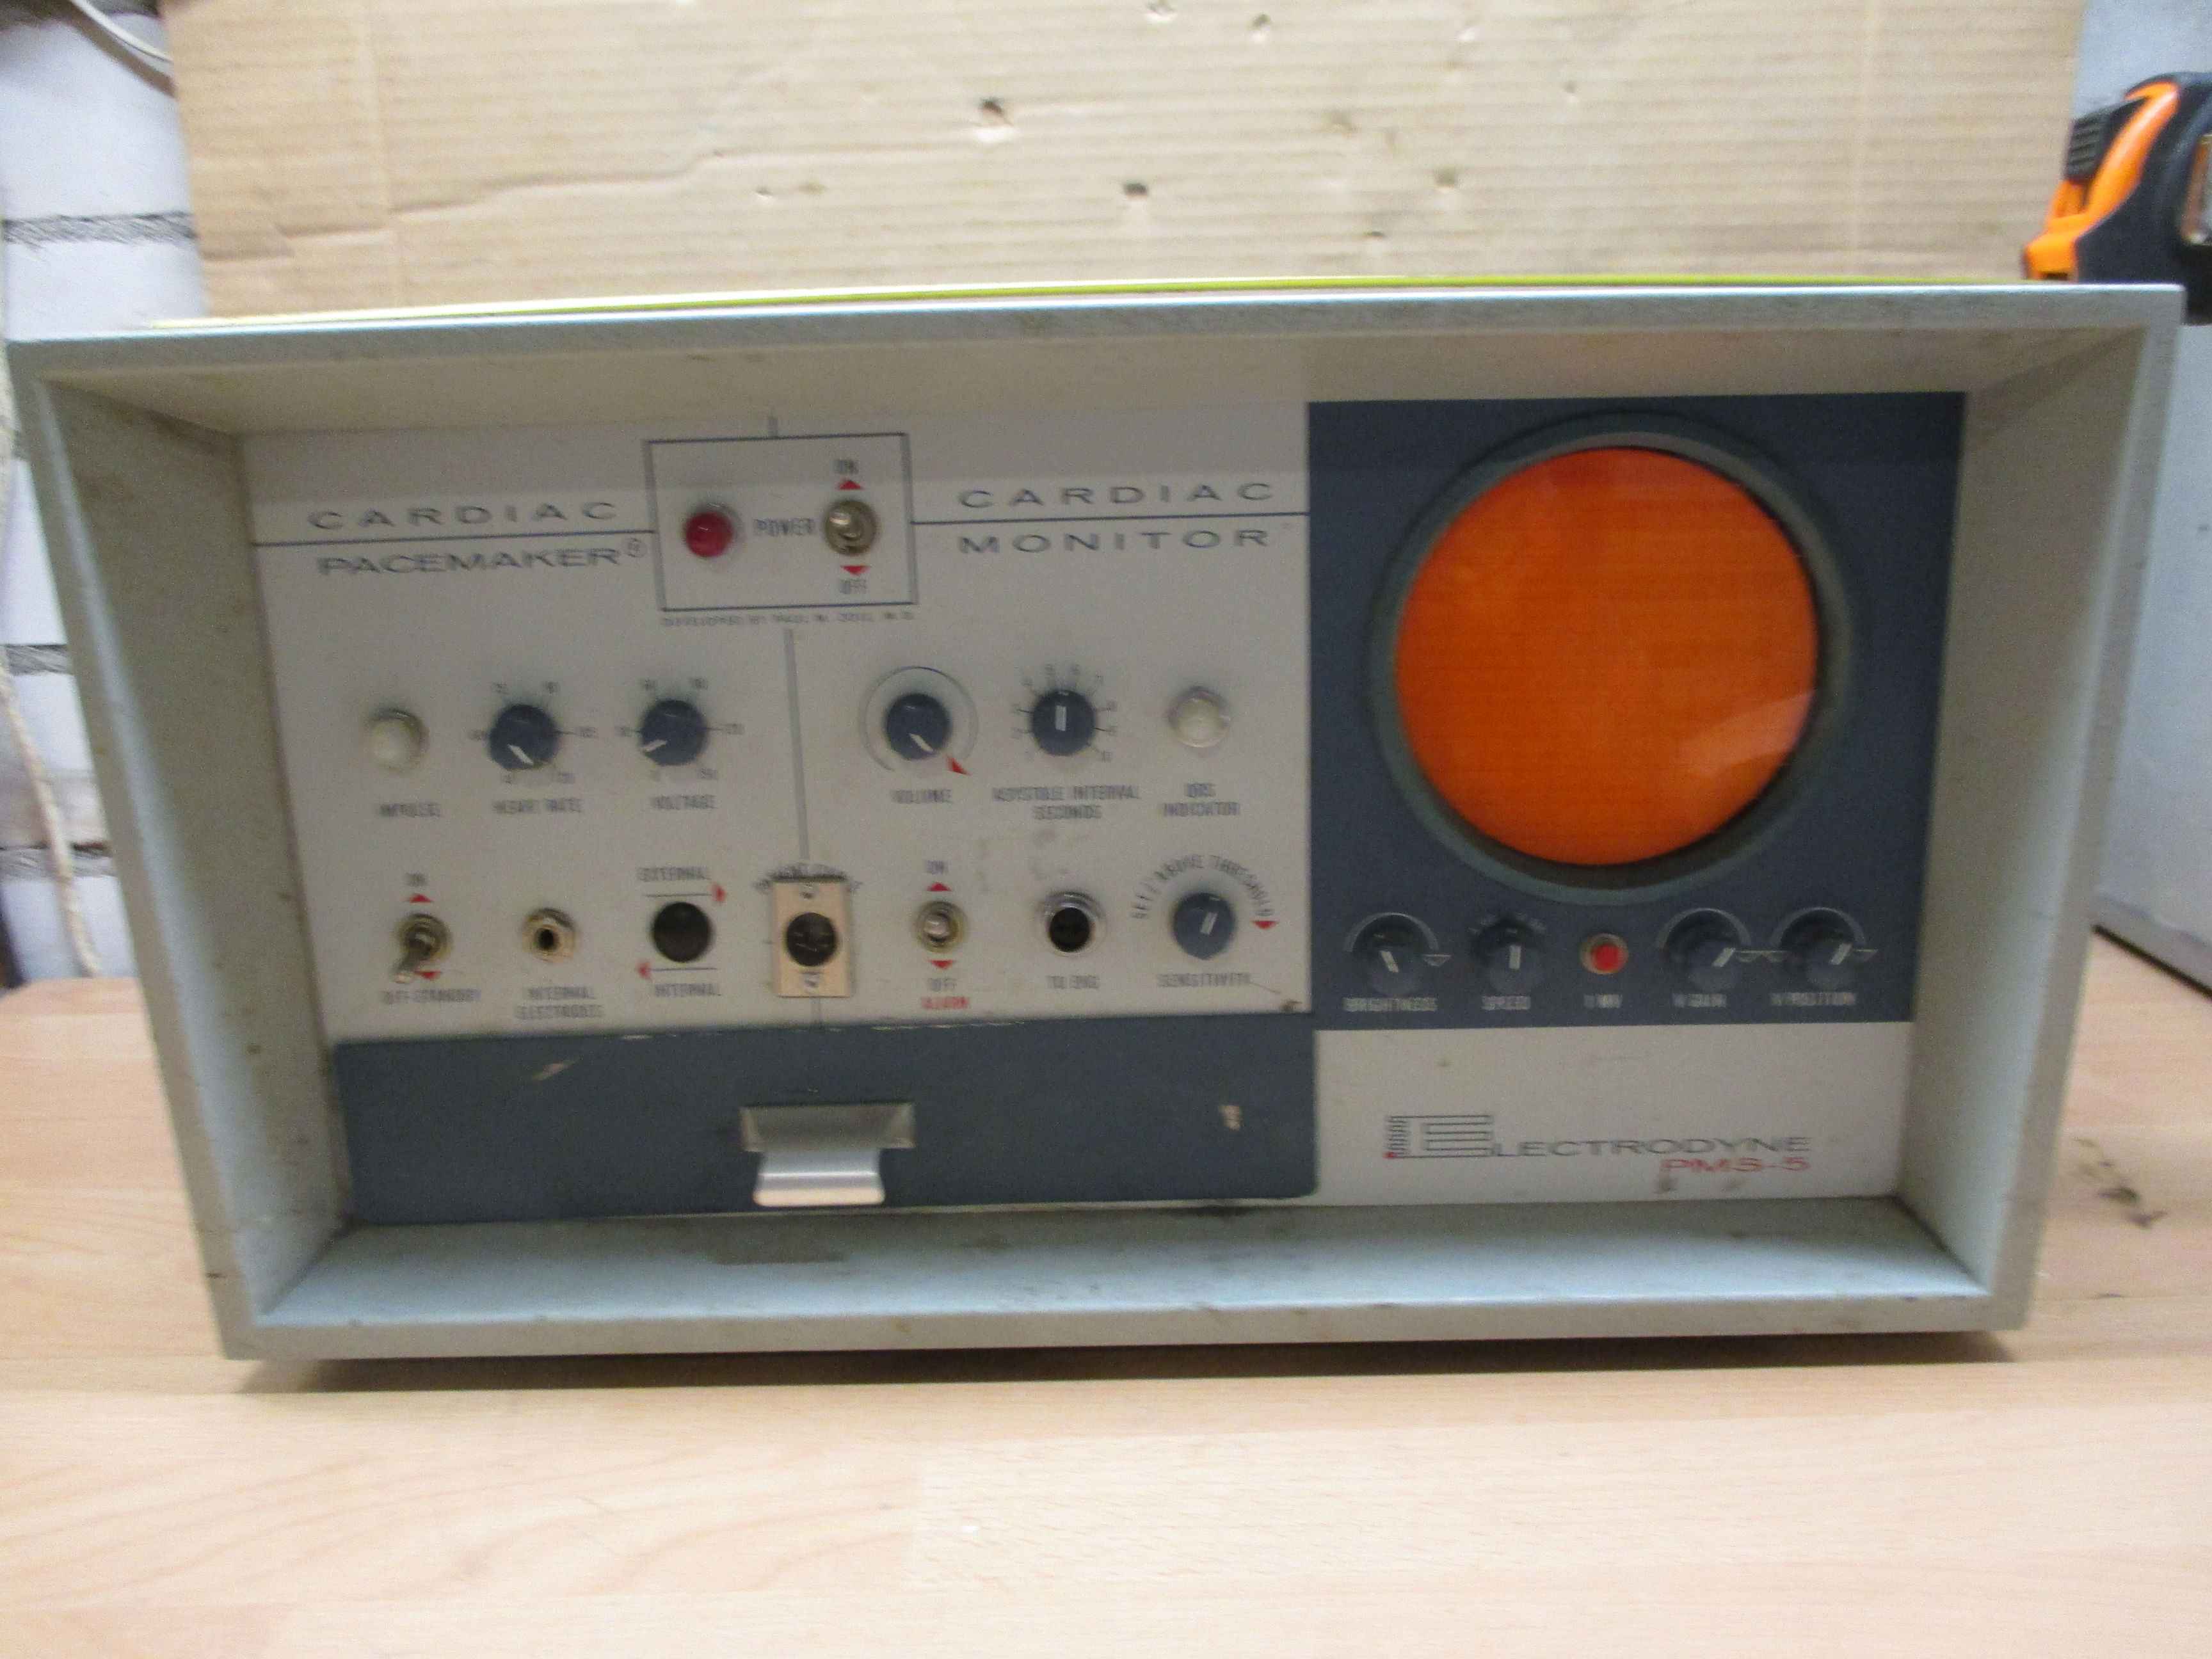
1960’s. Electrodyne replaced
the PM-65 system of the 1950's by the Electrodyne
“Pacemaker-Alarm-Monitor” PMS-5. The PMS-5 monitor is
mentioned in the literature as being used in some of first
Cardiac Care units of the early 1960s'. The PMS-5 had
an integrated pacemaker section and was marketed until about
1968.
The
venerable Electrodyne
PMS-5 shelved at a high elevation. Note the Electrodyne TR-3 pacemaker on the
table at right. Early 1960's.
Electrodyne PMS-5
Cardiac monitor and pacemaker system. Dallons released a
twin-beam cardioscope in 1960
and this was mentioned and pictured in the flight surgeons
report following the Mercury-Redstone missions 3 and
4. The cardioscope was
used for pre-flight checking of the space suits biomedical
sensor systems. Dallons
also subsequently released a couple of versions of its
twin-beam unit in the form a fetal/maternal ECG monitor and
as an ECG/EEG monitor. An explosion proof monitor, the
CS-3X, was released in the early 1960’s. The unit was
of tubular shape of 5” diameter and nearly 20” long.
In the mid 1960's Dallons
released a new and more compact monitoring system ("Master
Monitor") which incorporated an "exclusive" full ECG lead
selection dial. This allowed for selection of one the
ECG leads: I, II, III, AVR, AVL, or AVF. The monitor had a
three-inch diameter or optional five-inch diameter circular
display. Many monitors of this decade did not have a
full ECG selection dial and might allow selection of one of
three leads or none at all.
With no lead selection options, the user would establish the
lead to be viewed based on the electrode cabling connection
arrangement applied on the patient. It should be noted
that disposable flexible electrodes appeared in the middle
of the decade. In the mid to late 1960's the Datascope
"Carditron" and the Electrodyne
MS-25L, for example, included a selector switch for viewing
one of 12 leads.
The Dallons Twin Beam Cardioscope
of 1960. At 48 pounds it still weighed less than some
bedside monitors appearing years later such as the Spacelabs
PC of 1985. In the mid
1960's, several vendors offered a magnetic tape
"memory-loop" feature that served to continuously record the
last 15 or more (depending on vendor) seconds of data so
that alarm events could be interpreted based on the
preceding data. Automatic printing of stored data
following an alarm could occur. This concept has
persisted and is used with modern systems albeit digitally. By the mid
1960’s most prominent vendors offered equipment in modular
pieces which included separate devices for central
monitoring of alarm conditions. The modular
pieces could each consist of devices for heart rate
indication, temperature indication, pacing, tape memory,
etc. These modular pieces would slide into a larger
rack. In the mid 1960’s, Sanborn (Later Hewlett
Packard) offered modular pieces in self-contained enclosures
instead of rack mounted modules. In 1966, Sanborn even
offered a numeric readout accessory module for blood
pressures, temperatures, and heart rate. Digital
readouts were achieved using Nixie tubes up until the early
to mid-1970’s and were then replaced by LED displays. In the
early 1960’s, Electrodyne
released the S-3A and MS-21 ECG monitors. These
devices were relatively compact with their round 3-inch
diameter screens and they did not incorporate
pacemakers. The MS-21 included an analog gauge
indicator for heart rate. Larger (five-inch
diameter screen) equivalents of the S-3A and MS-21 were the
S-5B and MS-25 respectively. The MS-35 which appeared
in 1967 included connections for synchronized placement of
external “counter-shock” when used with the Electrodyne
DS-95M defibrillator. The Electrodyne
RM-2 from the mid-1960's was used centrally for monitoring
of two patients and incorporated two significant
features: an audible QRS indicator tone and a
variable alarm delay feature to reduce false alarms from
motion artifacts. The QRS tone was also available with
the Electrodyne MS-25 of
1967. In
order to
improve heart rate measurement accuracy some monitors of the
latter part of the decade began using specific R-wave
detection circuits which would filter out baseline wander
and artifacts arising from patient movement and could
discriminate against P and T waves. These included the
GE series 9000, American Optical Cardio-care systems, and
the Datascope Monitron. The
Electrodyne PMS-5D and the American Optical Cardio-Care
monitor of the mid to late 1960s' incorporated a demand
pacemaker instead of an asynchronous pacemaker. Although
transistorized equipment such as the Electrodyne
TR-3 pacemaker appeared in the late 1950’s, much equipment,
such as the MS-21 monitor, was not transistorized in the
early 1960s’. Instead they continued to use vacuum
tube technology since this technology was mature, high
performance, and reliable compared to transistors of that
era. " Solid state" equipment (along with imitation
wood veneer on equipment housings) began appearing on a more
consistent basis beginning around 1968. Some
exceptions to this were the Sanborn 760 series and the RecorDisplay from Invengineering
which had "transistorized" preamplifiers early in the
decade. Equipment using vacuum tube technology
required a longer warm-up time than solid state devices. From around
1966 onwards the demise of the three and five-inch circular
display began. Vendors began incorporating a new type
of CRT which was larger and rectangular. A
rectangular shape is better suited for the display of
multiple waveforms than a round CRT. Spacelabs
introduced the Model 170-1103 oscilloscope in 1966 which
featured an eight inch
(diagonal) monitor. In 1968, Hewlett Packard released
the Model 7803A “Monitorscope”
which had a similarly “large” screen. Significant,
with this latter device was the heart rate information which
was displayed using the CRT. A horizontal line would
progress across the bottom of the screen with the heart rate
as a bar graph. The screen itself was imprinted
with graduations and numerals to allow reading of the heart
rate. This approach to heart-rate presentation would
be used by various vendors into the next decade.
Honeywell also introduced a bedside monitor with a seven
inch display in 1969. The
1970s’: The Impact of Digital Electronics: The
decade of the 1970’s saw some significant improvements in
the presentation of the displayed waveforms and
information. This was a result of the incorporation
of digital electronics and, eventually,
microprocessors. Real time (centrally controlled and
processed) arrhythmia analysis appeared at the beginning
of the decade and evolved over the duration of the
1970’s. Standards documents which established
minimum performance criteria for physiologic monitors
began appearing from several bodies such as the
"Specification for Biomedical Monitoring Systems" X-1414
of 1970 from the Veterans Administration. The
appearance of the so called “Memory Monitor” occurred at
the beginning of the decade. These monitors incorporated
analog to digital converters and small memories to briefly
store several seconds of incoming data. The stored
data was then used to define the display on the CRT.
The advantage of this scheme was that the stored data
could be written to the screen quickly and repeatedly at
the same location well before it would fade out resulting
in a “non-fade” persistent display. Waveform data
was presented either as a moving wave that scrolls from
right to left or as a stationary waveform that is
overwritten by the trailing left edge of a narrow "eraser
bar" which travels from left to right. Modern
monitors use one display method or they permit selection
of either of these modes of display. Some memory monitors
also allowed data to be cascaded. This meant that an
ECG trace would continue on
the line below thereby providing more visible information
over a greater time period. The display of most
memory monitors could also be stopped or “frozen” for
review of the appearance of a particular
waveform. Also, printing or viewing
of several seconds preceding an alarm condition was
possible with some systems. Electrodyne
claims to have introduced the first non-fade patient
monitoring system, the “Computa
View”, around 1970 and claims to have dominated the
non-fade market in the early part of this decade. An
“advanced" Computa View was
introduced in 1972.
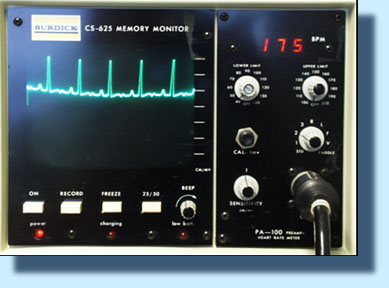
The Burdick
CS-625 Memory Monitor. Note the red numerals are
used for the heart rate and the limited space for multiple
waveforms. Circa. early to mid 1970's est. The
Westinghouse patient monitoring system of 1970 featured an
“exclusive” heart rate computer with automatic gain
control. This system as well as others from this
period, such as those from General Electric and
Mennen-Greatbatch, began incorporating isolated ECG inputs
for patient electrical safety. Isolated inputs would
extend to all monitored parameters within a few years. The
beginnings of arrhythmia analysis occurred in the 1970’s
and relied upon the connection of an ancillary
computer. In 1970, Smith Kline Instruments offered
monitors which could interface to a computer and could be
used for PVC detection and other tasks. The
instruments also had integrated numerical displays on the
front panel. Mennen-Greatbatch and American
Optical offered systems in 1972 whose arrhythmia
computer would learn normal ECG’s; a feature common with
modern systems. The American optical system detected
ectopic beats, prematurity, delay, compensatory pause, and
atypical morphology. The Mennen-Greatbatch model
515/G Cardio/Sentinel monitor of 1972 included pacemaker
spike detection and rejection capabilities. The
Siemens Sirecust 300 DU of
1978 offered pacemaker spike rejection and could still
permit viewing of the spikes but would not count
them. The unit also featured high frequency
protection from electrosurgical equipment. Although
the bouncing ball display was fading from the scene, HP
resurrected an incarnation of its 1968 era Model 7803A
“Monitorscope” as an economical
operating room monitor (model 7833A) around 1978. Variable
sweep speed selection became commonly available beginning
around 1973 with the SE laboratories SEM 432. Sweep
speed selection usually included 25, 50, and sometimes 100
mm/s speeds. Although
analog gauge indicators were still in use, the display of
heart rate information was often accomplished by a
horizontal bar graph type indicator which was integrated
with the CRT display as appeared late in the previous
decade. The CRT bezel was inscribed with a graduated
scale indicating the heart rate. Some monitors of the
early 70's, such as the HP78330A, over-laid parts
of the heart rate bar graph with thicker lines in
those regions where the high and low alarm limits were
set.
Even
though central systems from Abbott, GE, Gould, and Smith
Kline had numeric indicators in the early 1970’s, this
approach was more commonly used for heart rate on bedside
monitors later in the decade. The Birtcher
7000 “Monitorscope” from the
middle of the decade used a vertically oriented bar graph
and a separate digital display for heart rate
information. In 1975, BD-Electrodyne
released a monitor which had LED displays for both heart
rate and pressure values. The
middle of the decade saw the introduction of
microprocessors and thus the beginning of modern
monitoring systems. Spacelabs claims to have
launched the first (bedside) monitoring system which
incorporated microprocessor technology in 1974.
Among other things, microprocessors enabled further
exploitation of the CRT as a means to
display information. By 1978 some vendors such as
Hewlett Packard and Philips began integrating the heart
rate information on the CRT display as a numeric value (in
models HP78341A
and HP78342A
and Philips model CM-120). In summary, heart rate
presentation evolved over the course of the decade from
a bar-graph display to a numeric LED display located
next to the CRT on the front panel and then to a numeric
integrated with the CRTs’ display. The 1980s’: Modularity and Bedside
Arrhythmia Analysis: The
1980’s witnessed further significant evolution in patient
monitors. Arrhythmia analysis became available at
the bedside instead of centrally. Monitors began
using color displays, monitoring networks became more
sophisticated and monitors became computerized.
Since the display size increased in the 1980's, the number
of waveforms that could be displayed on a monitor
increased over the course of the decade from approximately
two waveforms to six waveforms. The
beginning of the decade witnessed some new developments in
monitors themselves. For example, Siemens introduced
the Sirecust Series 400 in
1980. This unit had three notable enhancements:
bed-to-bed or “interbed” viewing, parameter modules, and
membrane-switch design. The Abbott Lifecare 5000
monitor of 1981 had bed-to-bed viewing as did the E for M
Honeywell CM140 of 1981. Bed-to-bed viewing has
become a standard feature of modern monitors. It
allows the clinician to review another
patients’ waveforms and data from a different bedside
monitor connected to the monitoring network. This
was touted to further improve nursing efficiency by taking
away the need to keep returning to the central station to
view other patients. Also, patient data could be
entered at the bedside rather than at the central.
The membrane switch design has become standard with modern
monitors and provided a sealed front panel area.
This is more hygienic and resistant to fluid
ingress.
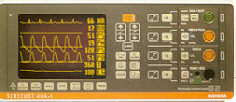
The Siemens
Sirecust 404-1 of the
early 1980's Note the monochrome screen with integrated
numerical information. Modules are on the right. While
modularity of monitoring systems had been heavily marketed
throughout the previous two decades, the modularity was
primarily intended to allow for various initial
configurations to be achieved when installing a monitoring
system in a particular area.
The new “hot-swappable” modularity which appeared in the
1980s’ was meant to allow adjustment of the actual
parameters available to be measured from one patient to
the next. The advantage of this modularity was
economical since by sharing modules with lesser used
parameters, such as cardiac output, a hospital would not
have to fully load all bedside monitors with all
parameters. By the middle of the decade, most
monitoring systems offered parameter modules. It
should be noted that this role has faded from importance
with the increased miniaturization of modern systems which
have compact multi-parameter all-in-one modules. Hewlett
Packard introduced their modular Merlin system in
1989. Before that time, HP was providing
configured monitors. HP promoted a wider patient
data management concept for its monitors (HP78707A) from
the early part of the decade. Twenty-five years
later, monitors are continuing to promote the provision of
data management and presentation capabilities beyond
simple physiological measurements. Electronic
automatic non-invasive blood pressure and pulse oximetry
were two new notable parameters which became available in
the 1980’s. Also, HP introduced the 47210A
capnometer at the beginning of the decade in North America
and this parameter evolved to become commonly used as had
already occurred in Europe. In
1983, the Burdick Color-Trend monitor (model M565) was
introduced. This monitor featured a color screen and
would display different parameters with unique
colors. Color monitors would still require a few
more decades to become standard and were often an optional
and costlier proposition in systems of the mid to late
1980’s. It should be noted that Midwest Analog and
Digital offered a central monitoring system in 1978 which
used color to distinguish individual patients from others
on the same screen. Unlike
other systems of the period which had the numerical
information listed along the right side of the CRT
display, the Burdick Color-Trend monitor had Numerical
parameters on the left. The Philips CM-120 from the
prior decade which became an E for M/Honeywell system in
the early 1980’s displayed numerical parameters along the
bottom. The Electrodyne
STAT-scope IV listed numerics
along the top. Most systems have standardized on the
default position of numerical parameters to be on the
right side of the CRT. (Some more modern systems
from Fukuda Denshi, Nihon Khoden,
and MDE allow numerical parameters to be displayed on the
left). In general, having the numerics
listed along the top or the bottom had the advantage of
permitting a longer waveform to be displayed. Nihon
Kohden claims to have been the
first to supply bedside arrhythmia analysis with its Life
Scope 10
OEC-5501
Heart Monitor which was introduced in 1982.
Spacelabs claims of being the first to allow viewing of
real-time arrhythmia data at the bedside in 1979. In
any event, by 1980, arrhythmia analysis was primarily
available as a centrally coordinated feature of the
central monitoring station of many systems such as the
General Electric PDS3036, Becton Dickenson Vigilant
arrhythmia identification system, and the Hewlett Packard
78220. By 1983, E for M/Honeywell and Marquette
offered bedside arrhythmia analysis. The Marquette
system 7000 of 1983 boasted simultaneous four-lead
arrhythmia analysis at the bedside. The Siemens Sirecust 400 offered bedside
“oriented” arrhythmia analysis. ST segment analysis
also became available in the middle of this decade. Larger
monitor screens began appearing regularly after the middle
of the decade. Around 1985, Spacelabs introduced the
“PC” bedside monitor which incorporated a relatively large
monochrome touch screen and relatively large parameter
modules. The PC was replaced with a color screen
version, the “PC2”, at the end of the decade. These
units could be configured as either a bedside or central
which reduced the hardware variety of the system.
Generally, however, central monitors would be equipped
with a larger display than a bedside monitor. In
1987 Siemens replaced the Sirecust
400 with the Sirecust
1281. The new model featured a larger screen with
optional color. Data
input is usually achieved by a combination of rotary menu
selectors and membrane soft-key switches. Keyboards
and mice have not been easy to introduce in the bedside
environment due to space and hygienic issues. Touchscreen
bedside monitors would become common 25 years later
on.
The 1990s’: Mobility and
Connectivity: Monitors
of the 1990s’ became more flexible and efficient in their
deployment and setup and began accepting and presenting
data from other sources such as medical equipment and
hospital departments. Portable monitors evolved to
become quite capable and the continuum of care monitor was
developed. Some monitors forayed into the employment
of non-proprietary approaches to software connectivity. While
patient monitoring systems are
located in areas such as the Emergency
Department, Operating Room, and Intensive Care, it was
entirely common for one of those areas to have monitors
from one manufacturer and of different make and model from
monitors in another area of the same hospital.
However, in 1990 and onwards, transport monitors appeared
which provided more technical impetus to having a hospital
wide standardized monitoring system. These monitors
permitted the transfer of their parameter module to a
bedside monitor of the same vendor and thereby provided
for one-time setup of patient connections.
Systems such as the Spacelabs PC Express of 1990 and PC
Scout of 1994 would allow transfer of stored trended
data. The same parameter module could stay with the
patient from Emergency to intensive care for
example.
The Spacelabs
PC Express transport monitor of 1990. Note the
two parameter modules inserted at the bottom. Another
approach which increased proliferation of the same
vendors’ monitors throughout an institution was to
establish vendor specific monitoring network connections
at many bedside locations so that network-compatible
monitors could be connected into the monitoring network at
patient bedsides where needed. This included the
Spacelabs Quicknet Interface
of 1994 and the Siemens “Pick and Go” system of
1996. The entire monitor would travel with the
patient and, unlike regular transport monitors, would be
connected to a monitoring network after travel. This
foreshadowed the wireless transport monitor such as the
Spacelabs PC Ranger of 1996 and the Marquette Eagle 4000
of 1999 which would remain connected to a network by their
wireless link. Monitors
in the 1990s also allowed for connections to other types
of critical equipment at the patient bedside.
Connection to other equipment such as ventilators, pulse
oximeters, and infusion pumps was possible. An
example was the Spacelabs flexport
serial interface and their PCMS of 1990. This is
advantageous if the new data can be transmitted over the
monitoring network to the central and other
monitors. Since equipment such as ventilators are
designed with their own integrated displays and alarm
signals, the challenge to the monitor was the relaying of
the data and alarms in a useful way without losing key
information or alarm signals. In 1995 the Spacelabs UCW
monitor could interface with other hospital information
systems such as the laboratory and pharmacy. This
was implemented using their “Dynamic Network Access
(DNA)”, called winDNA, which
could run standard Windows applications. Hewlett
Packard released their “LabVue”
system that allowed monitors to display lab results in
1996. The HP Viridia
system of 1997 incorporated the Windows NT operating
system. The
CRT is heavy by nature and therefore not ideal for
transport monitors. Monochrome LCD displays appeared
in the early part of the decade for transport monitors
such as in the HP component transport system and the Datascope Passport monitor.
Flatscreen amber
electroluminescent displays were also deployed for a few
years beginning around 1990 in the Spacelabes
PC Express and later with the Marquette Eagle system for
example. This was followed by color LCD’s by the end
of the decade. The
use of flat and thin monitors (no CRT) meant that the
patient monitors themselves could in theory be more
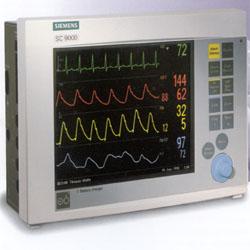
flat in shape with a smaller footprint. The
Marquette Eagle and Siemens SC9000 are two examples of
monitors with a flattened shape. Another design
change was to shift the location of the patient
connections to the side of the monitor. This design
change allowed parameter modules to be inserted into the
side of the monitor instead of the front thereby keeping
the dimensions of the monitor flatter with less
depth. The parameter modules which were so commonly
employed in the 1980's and 1990's began to be replaced by
"dense" and more compact integrated or configured
parameter acquisition panels.
The Siemens
SC 9000 of the late 1990's. Note the configured
cable connections along the left side and the short depth of
the unit. The Early 21st Century
and Beyond: Monitors
of the 1990’s usually had to be configured for the type of
location such as the OR versus emergency. Appearing
at the end of that decade and into the new century was a
new generation of monitors which were designed to be
flexible enough to remain with the patient through various
stages of acuity and during transport. These
monitors support the continuum-of-care approach to patient
care. These monitors leveraged the increased
miniaturization of parameter modules and the lighter
flat-screen technology. Transport monitors with
their more limited subset of parameters are replaced by
the more capable continuum of care monitors. An
example is the Siemens Infinity SC 9000XL monitor. The
Siemens Infinity monitors also offered connectivity to the
internet in 2000. This allowed the clinician to use
the internet or the hospitals intranet to remotely view a
particular bedside monitors
real-time waveforms, vital signs and trends. We
anticipate
that the ubiquitous PC will become used as the primary
monitoring system component. In the prior century,
the graphical and computational performance of the PC
lagged the capabilities of dedicated computer display
systems used for monitors. This has changed and
offers the potential for savings in hardware
costs. Additional electrical safety measures may
still be necessary for PC’s used in this medical
application. An acquisition system consisting of
input connections and signal conditioning circuitry will
be required and could be developed as a stand-alone
brick with a conventional interface to the PC via USB or
Bluetooth. The monitor display will evolve to be
8K high definition and will use the wider aspect ratio
of 16:9. This wide screen is advantageous for
monitors since a longer waveform can be displayed.
The high-definition display would be advantageous for
the display or overlay of ultrasonic and radiological
images retrieved by the monitoring system.
Software will become predominate over hardware
considerations for monitors and software updates via the
web should be possible. Networking will be mostly
wireless in the future and be facilitated by the web. Patient
data will be available on the network and become part of
the patients’ electronic medical record.
This could be accessed remotely by a clinician
for real time and historical analysis.
Just
as arrhythmia interpretation became standard in the
1980’s, as a means to
facilitate rapid diagnosis of potentially serious patient
conditions, we predict that interpretation of data from
all sources available to the monitor will occur via
AI. That is, the monitor will assess the
physiological data, lab results, patient history and
condition to interpret the patients’ status and to relay
this to the clinician. The clinician will
undoubtedly want to verify the monitors’ interpretation
with their own assessment. Eventually,
like an automated external defibrillator, the importance
of the display may diminish and even disappear. The
primary goal or output of the monitoring system could be
an AI
driven advisory type assessment of the patient. The
acquired data could be reviewed in detail at a workstation
if needed. New
parameters to be measured will arise and improvements in
current measurement technique will certainly occur.
Our understanding of the relative importance of the
parameters will increase and we will learn what to watch
for. The trend towards the development of
non-invasive techniques will continue. There may be
some overlap between physiologic monitoring and medical
imaging. That is, medical imaging techniques may
yield more physiologic information from its inherent
non-invasive approach and signal processing. Eventually
physiologic monitors as we know them will probably become
obsolete and may be replaced by nanotechnology instruments
capable of elaborate analysis of body chemistry and
condition. If these devices are cheap and plentiful,
it would allow more predictive medical assessments leading
to better preventive and personalized care. 1950:
First ‘modern’ monitor reported in use. 1954:
First appearance of production monitors (Cambridge cardioscope). 1956:
Production monitors enter clinical use (Electrodyne
PM-65). 1966:
Non-circular displays and Nixie numeric indicators are
employed. 1968:
Heart rate included on CRT as a progress-bar indicator. 1970:
The memory monitor appears which allows for a non-fade
display. Isolated inputs appear for added
patient safety. 1975:
LEDs employed as numeric indicators on physiologic
monitors. 1978:
Monitor displays include heart rate as a numeric on the
CRT. 1980:
Modern modular parameter modules appear. 1983:
Arrhythmia analysis available at the bedside. The
first color physiologic monitors appear. 1990:
Transport monitors appear which could transfer the same
patients’ module and cabling to a compatible bedside
monitor. Flatscreen
(non-CRT) monitors appear on physiologic monitors. 1995:
Some monitors can run Windows applications. 1996:
Continuum of care monitors appear
and parameter modules begin to be replaced by configured
acquisition panels on the side of monitors. 2000:
Internet connectivity at the bedside becomes available. Himmelstein
A., Scheiner
M. The Cardiotachoscope.
Anesthesiology. 1952 Jan;13(1):62-4 W.
H. L. Dornette, Editor, Instrumentation
and Anesthesia, F. A. Davis Company, Philadelphia,
1964. H.
W. Day, History of coronary care units. Am J Cardiol. 1972;30:405-407. B. R.
Klein, Introduction to Medical Electronics – for
Electronics and Medical Personnel, Tab Books, 1975. D.
H. Glaeser, L. J. Thomas Jr.,
Computer Monitoring in Patient Care, Annual
Review of Biophysics and Bioengineering, Vol. 4: 449-476 Jun
1975 L.
Cromwell, Medical Instrumentation for Health Care,
Prentice Hall, 1976. F. Biloon,
Medical Equipment Service Manual: Theory and Maintenance
Procedures,
Prentice Hall, 1978. R.
J. Traister, Principles
of Biomedical Instrumentation and Monitoring, Reston
Publishing, 1981. Evaluation
of Operating Room Monitors, ECRI Health Devices,
April 1982, Vol. 11, No. 6. Physiologic
Monitoring Systems Evaluation, ECRI Health Devices,
Jan-Feb 1999, Vol. 28, Nos. 1-2. Trends
in Physiologic Monitoring Systems, ECRI Health Devices,
Oct 2004, Vol. 33, No. 10. Physiologic
Monitoring Systems Evaluation, ECRI Health Devices, Jan
2005, Vol. 34, No. 1. Additional
sources: “Modern Hospital”,
“Modern Healthcare” as well as “Anesthesia and Analgesia”
featured sections on new products and hosted advertisements
from monitoring equipment vendors. |

|
|
|
|
|
![]() This
site © 2002-2018, Femtosim
Clinical Inc. All Rights Reserved. Contact: info@femtosimclinical.com
This
site © 2002-2018, Femtosim
Clinical Inc. All Rights Reserved. Contact: info@femtosimclinical.com